PowerPoint 2016 automatically resizing charts pasted as metafiles

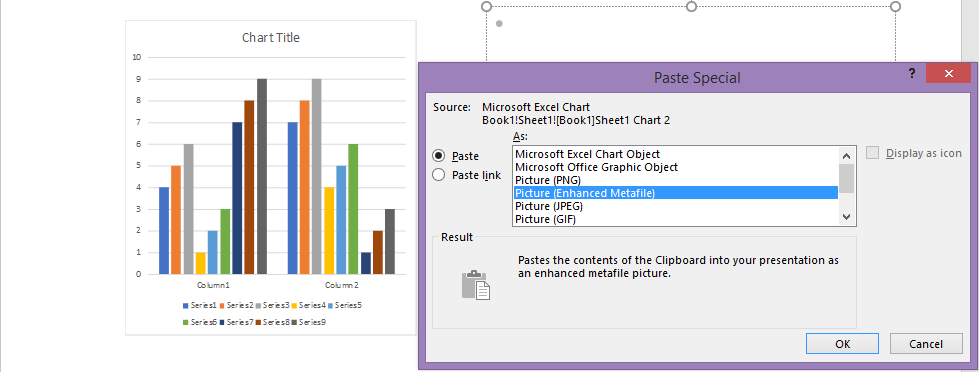
I draw charts in Excel and paste them into PowerPoint presentations, typically as Enhanced Metafiles, which has never posed me a problem with previous versions of PowerPoint.

However, in the latest version when I paste a chart as a Metafile / Enhanced Metafile its height / width become ~30% larger than the Excel original.  Why? This does not happen when it is pasted in as a PNG / JPEG / GIF / Bitmap - the dimensions stay the same.

This problem does not apply in Word 2016 - the paste sizes are the same regardless of format

* Please try a lower page number.

* Please enter only numbers.

* Please try a lower page number.

* Please enter only numbers.

Hi Graeme,

Based on your description, the picture size changes when you paste the Excel chart as a Metafile / Enhanced Metafile to PowerPoint. I would like to check the following:
1.    Ensure you follow the steps below to paste the Excel chart as Enhanced Metafile to PowerPoint.
a.    Copy the Excel Chart in Excel 2016.
b.    Go to PowerPoint 2016, click the drop down under Paste in Home tab.
c.    Choose Paste Special and select Picture (Enhanced Metafile).
2.    Quick repair Office 2016.

If the issue persists, could you please provide the information below?
1.    The version of Office 2016.
2.    Detailed steps about how you encounter the issue.
3.    Related screenshots about the resized charts in PowerPoint.

Regards,
Yoga
-------------------------------------------------
If you feel a reply works for you, please kindly vote or mark it as it will be beneficial to other community members reading this thread.

Was this reply helpful?

Sorry this didn't help.

Great! Thanks for your feedback.

How satisfied are you with this reply?

Thanks for your feedback, it helps us improve the site.

How satisfied are you with this reply?

Thanks for your feedback.

Hi Graeme,

Do you have any updates?

Regards,

Yoga

-------------------------------------------------
If you feel a reply works for you, please kindly vote or mark it as it will be beneficial to other community members reading this thread.

Was this reply helpful?

Sorry this didn't help.

Great! Thanks for your feedback.

How satisfied are you with this reply?

Thanks for your feedback, it helps us improve the site.

How satisfied are you with this reply?

Thanks for your feedback.

Hi,

Sorry, it took me a long time to respond on this as I had uninstalled Office 2016 from my computer.  I have now reinstalled it on a separate computer via Office 365.

You will see below that the problem remains the same in Office 2016.  The chart on the RHS has been pasted in as an Enhanced Metafile from Excel while the chart on the LHS (the same size as the Excel original) has been pasted in as a PNG (or JPEG)

In Office 2013 if I paste the chart in as an Enhanced Metafile from Excel then it remains its original size, as shown below:

This does not happen with Word 2016.  Whether I paste from Excel into Word 2016 as an Enhanced Metafile or a JPEG the size is the same.

Regards,

Graeme

Was this reply helpful?

Sorry this didn't help.

Great! Thanks for your feedback.

How satisfied are you with this reply?

Thanks for your feedback, it helps us improve the site.

How satisfied are you with this reply?

Thanks for your feedback.

Hi Graeme,

Thanks for your update.

I suggest you ensure you have followed the steps below to insert a chart in PowerPoint 2016.
    1. Click the text box in PowerPoint slide where you would like to insert the chart.
    2. Copy the chart in Excel 2016.
    3. Click Paste Special under the drop down of Paste, select Picture (Enhanced Metafile).

If the issue persists, please provide version of Office 2016: File> Accout> Product Information.

Regards,
Yoga
-------------------------------------------------
If you feel a reply works for you, please kindly vote or mark it as it will be beneficial to other community members reading this thread.

Was this reply helpful?

Sorry this didn't help.

Great! Thanks for your feedback.

How satisfied are you with this reply?

Thanks for your feedback, it helps us improve the site.

How satisfied are you with this reply?

Thanks for your feedback.

There's a bug with pasting as a metafile which increases the size by around 30% (not always exactly though)

You can see this by simply drawing a shape. COPY and paste special as EMF. The pasted shape will not be the same size.

I don't know of a workaround except resizing until MSFT fix it. You would think the MSFT "Help" would know about it though.

www.pptalchemy.co.uk

1 person found this reply helpful

·

Was this reply helpful?

Sorry this didn't help.

Great! Thanks for your feedback.

How satisfied are you with this reply?

Thanks for your feedback, it helps us improve the site.

How satisfied are you with this reply?

Thanks for your feedback.

Thanks, John.

That's what I assumed

Was this reply helpful?

Sorry this didn't help.

Great! Thanks for your feedback.

How satisfied are you with this reply?

Thanks for your feedback, it helps us improve the site.

How satisfied are you with this reply?

Thanks for your feedback.

Prerequisites:
Platform: Windows 7 x64
Office Version: Office 2016 MSO 16.0.4549.1000 x86


Repro Steps:

 Prepare a copy paste source in Microsoft Excel 2016 
  1. Open a fresh instance of Microsoft Excel with a new workbook

  2. In cells A1 and A2 enter the values 1 and 2 respectively

  3. In cell B1 enter the formula “=RANDBETWEEN(1,10)”

  4. Copy cell B1 and paste it into cell B2

  5. Select the range A1:B2

  6. Drag fill the range to row 10 such that cells A1 through A10 are numbered 1 through 10 and cells B1 through B10 have randomly calculated values

  7. Convert the formulas in column B to values by selecting the range B1:B10 then perform a copy/paste values

  8. Select the range A1:B10

  9. On the “Insert” tab, in the “Charts” section insert a line chart

  10. On the “Format” tab, in the “Size” section, adjust the size of the chart to a known, specific size, such as Height = 5, Width = 5

    It should be noted here that the issue IS NOT size or shape dependent.

    I only specify the size so the issue in PowerPoint is more instantly verifiable.

  11. Copy the chart to the clipboard

  1. Open a fresh instance of Microsoft PowerPoint 2016 with a blank presentation

  2. On the “Home” tab, in the “Clipboard” section, click the arrow under “Paste” and select “Paste Special…”

  3. In the “Paste Special” dialog box, select “Picture (Enhanced Metafile)”

    EXPECTED RESULT: The copied chart should be pasted the same size as the original

    ACTUAL RESULT: The copied chart IS NOT pasted the same size as the original

  4. Press the DELETE key on your keyboard to delete the pasted object.

  5. In the “Paste Special” dialog box, select “Picture (Windows Metafile)”

    EXPECTED RESULT: The copied chart should be pasted the same size as the original

    ACTUAL RESULT: The copied chart IS NOT pasted the same size as the original

  6. Press the DELETE key on your keyboard to delete the pasted object.

  7. In the “Paste Special” dialog box, select any paste special option OTHER THAN THE TWO “metafile” options

    EXPECTED RESULT: The copied chart should be pasted the same size as the original

    ACTUAL RESULT: The copied chart IS pasted the same size as the original (or reasonably close given graphics resolution conversion limitations)

  8. Repeat steps 7 and 8 for all the other non-metafile options until all the different Paste Special options have been tested.

    EXPECTED RESULT: The copied chart should be pasted the same size as the original

    ACTUAL RESULT: The copied chart IS pasted the same size as the original (or reasonably close given graphics resolution conversion limitations)

  9. Open a Fresh instance of Microsoft Word 2016 with a blank document

  10. Repeat steps 4 through 6 within the Word document

    EXPECTED RESULT: The copied chart should be pasted the same size as the original

    ACTUAL RESULT: The copied chart IS pasted the same size as the original (or reasonably close given graphics resolution conversion limitations)

  11. Open a Fresh instance of Microsoft EXCEL 2016 with a blank workbook

  12. Repeat steps 4 through 6 within the Excel workbook

    EXPECTED RESULT: The copied chart should be pasted the same size as the original

    ACTUAL RESULT: The copied chart IS pasted the same size as the original (or reasonably close given graphics resolution conversion limitations)


Conclusion:
The “ACTUAL RESULTS” documented at steps 4 and 6 are UNEXPECTED/UNDESIRED results.

As such they constitute a reproducible “bug” in PowerPoint, particularly in light of the confirmation the UNEXPECTED/UNDESIRED result DOES NOT reproduce in Word 2016 or Excel 2016

Was this reply helpful?

Sorry this didn't help.

Great! Thanks for your feedback.

How satisfied are you with this reply?

Thanks for your feedback, it helps us improve the site.

How satisfied are you with this reply?

Thanks for your feedback.

Just some extra info

In 365 I used to see emf pastes being 30% (approx LARGER than expected as above. After recent updates they seem 30% SMALLER than expected! In WORD they are correct.

www.pptalchemy.co.uk

Was this reply helpful?

Sorry this didn't help.

Great! Thanks for your feedback.

How satisfied are you with this reply?

Thanks for your feedback, it helps us improve the site.

How satisfied are you with this reply?

Thanks for your feedback.

Thanks for the repro steps. I replied to this (or perhaps a similar message) yesterday, but the forum software seems to have eaten my response.

Short version, then:

I can repro this here on 365 and 2016 and also in 2010, so it's not a new problem, it seems.

I've reported it to MS and have heard back that it's a known issue and that a fix is likely in the works.  They can't say exactly when, of course. 

PowerPoint Help: https://www.pptfaq.com/
PPTools: https://www.pptools.com
Presentation Guild: https://presentationguild.org

Was this reply helpful?

Sorry this didn't help.

Great! Thanks for your feedback.

How satisfied are you with this reply?

Thanks for your feedback, it helps us improve the site.

How satisfied are you with this reply?

Thanks for your feedback.

LOL Steve, no, you're not seeing double!

I posted the repro steps in two threads.

However, I did notice an inconsistency between your two replies.
Here you mentioned you can repro in 2010 but the other thread you mentioned it does not.
Can you please confirm and if it does repro, would you be kind enough to post your build version and recent updates?

I'm the Office SME for a MAJOR corporation and we're in mid stream with Office 2016 deployment (from Office 2010).
Right now, it doesn't repro for us, but then we manage our updates very tightly.
If an update for 2010 has busted it, I'd like to know before hand if possible.

Also, in that other thread, there is a mention this now repros in Office 2007 after update(s) were installed.
I've asked in that thread for build and recent updates.

Was this reply helpful?

Sorry this didn't help.

Great! Thanks for your feedback.

How satisfied are you with this reply?

Thanks for your feedback, it helps us improve the site.

How satisfied are you with this reply?

Thanks for your feedback.

* Please try a lower page number.

* Please enter only numbers.

* Please try a lower page number.

* Please enter only numbers.


Question Info


Last updated May 3, 2024 Views 8,003 Applies to: