Hi Amir,
I realize these are unofficial support forums but I have found some useful information from reading through questions from other users. I appreciate your response! I decided to reach out here because there are some really helpful independent advisors on these forums that have started me on this troubleshooting path and I have learned a lot in the past few months.
I forgot to mention I have also ran "sfc /scannow" and "DISM.exe /Online /Cleanup-image /Restorehealth"
I have already done most of the steps you have suggested;
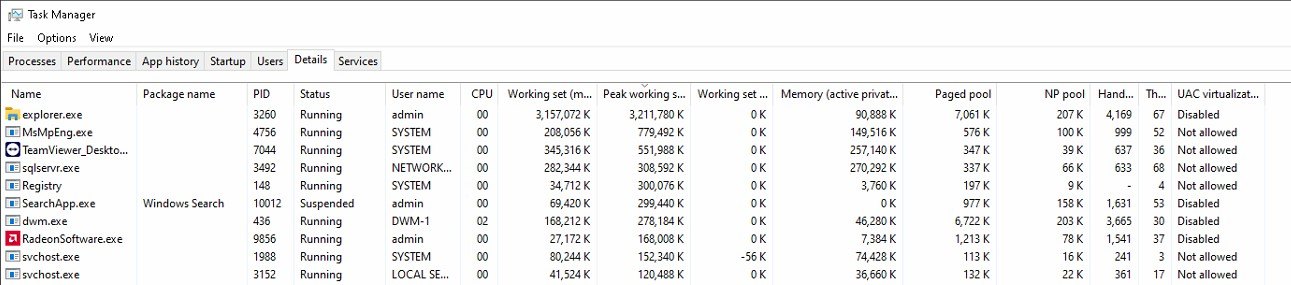
I have run a WPR multiple times but it is difficult to locate the issue. In a couple of days, I will run the WPR again and try to post a screenshot of the handles and memory when the PC is near critical. I can see handles being opened and some are closed but I am not sure if I am looking at an issue or if it's normal. BTW if you add the directory after the WPR - stop command you can put it anywhere. ie "wpr -stop ReferenceSet C:\handle.etl"
As for memory check, I can do it on one of the PC's but it's difficult as these PC's don't often get restarted and run the same applications at all times. I did not suspect faulty memory as the issue is occurring on multiple PC's with the same chipset. The likelihood of faulty memory on all the PC's is extremely remote. The non-Microsoft applications that are running on them are clean and running on hundreds of Intel-based PC's that we have. We have found memory leaks on some of the Intel-based PC's but we were able to pinpoint the raid controllers causing the issues and they were fixed via a driver update.
I have disabled any services that are not being used, and even some Windows services while I troubleshoot which have been known to cause issues with performance like superfetch (sysmain), NDU (setting to 4 in the registry, which I believe disables it), indexing, windows search and windows experience. Anything that would be classified as unnecessary overhead while trying to troubleshoot.
I have also added an entry for Multi-Plane Overlay in the registry: HKEY_LOCAL_MACHINE\SOFTWARE\Microsoft\Windows\Dwm - Entry OverlayTestMode DWORD Value of 00000005. I did this as DWM also gets mildly high but I am not sure if it's normal and does not get even close to the 1-2GB that explorer.exe reaches. Also, MPO has been known to cause issues with AMD display drivers with flickering and memory (I have recently enabled this and am unsure if this has yet to have an effect).
I had to reset explorer.exe on all the PC's before I decided to reach out here because I needed to start another project.
Here are the tools I have acquired through my extensive research on these forums and elsewhere which I have been using to try and locate the leak.
poolmon
processexplorer
RAMMap
VMMap
WPR
Shexview-x64 ( to disable and non-Microsoft handles )
Recently found ProcessHacker 2 ( combines a lot of these tools into one UI )
I used xperf in the past and might go back to trying to view those logs again but I feel I'm going in circles at this point.
I will run the Windows debugger as soon as the PC gets closer to a critical level. If there is anything from these tools that I could post that would help assist me please let me know. If you can point me possibly to a source that would explain what to look for in the Windows debugger logs? I will look for this information as well, possibly in one of the sources you listed.
Rick