
Want a quick overview of the Data Visualizer feature?
Updated:3/23/2018
Hello Insiders,
We've some very useful feature updates for you!
First, Visio Data Visualizer now supports bi-directional synchronization between the Excel data and the Visio diagram. Now keep both files synchronized and up-to-date, when you change the Excel data, refresh the diagram; when you change the diagram content, update the Excel data.
Where can I find these options?
Once you have created your diagram from data, click anywhere inside the diagram to enable the Data Tools Design tab in the ribbon. In this tab, you will find the following entry points (as shown in image below):
Refresh Diagram
Update Source Data

For more details read through Stage 6: Synchronizing the data and the diagram in this article.
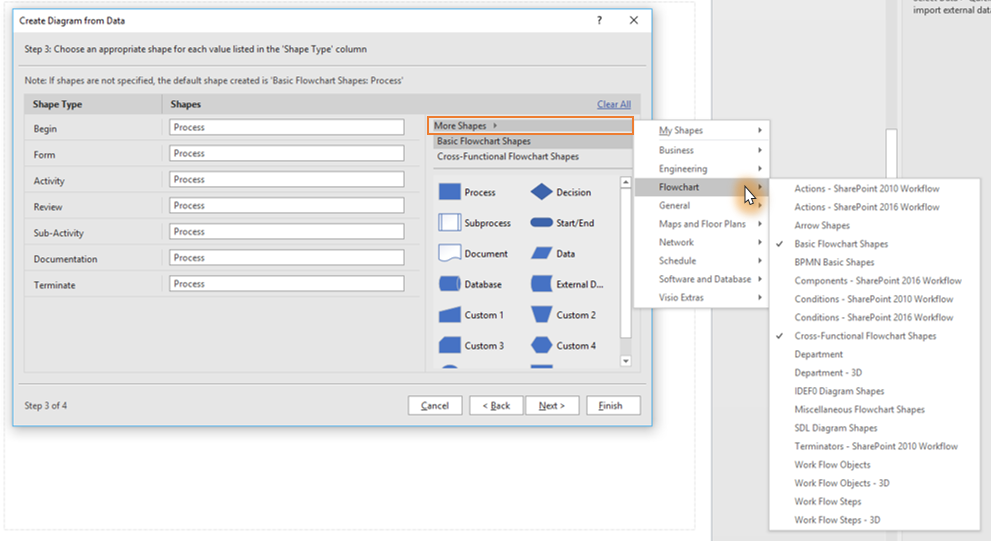
Second, now create Data Visualizer diagrams using any stencil of your choice! The shape mapping step of the Create from Data wizard allows you to select more shapes now. More details here.
----------------------------------------------------------------------------------------------------------------------------------------------------------------------
Updated: 9/27/2017
Hello Insiders,
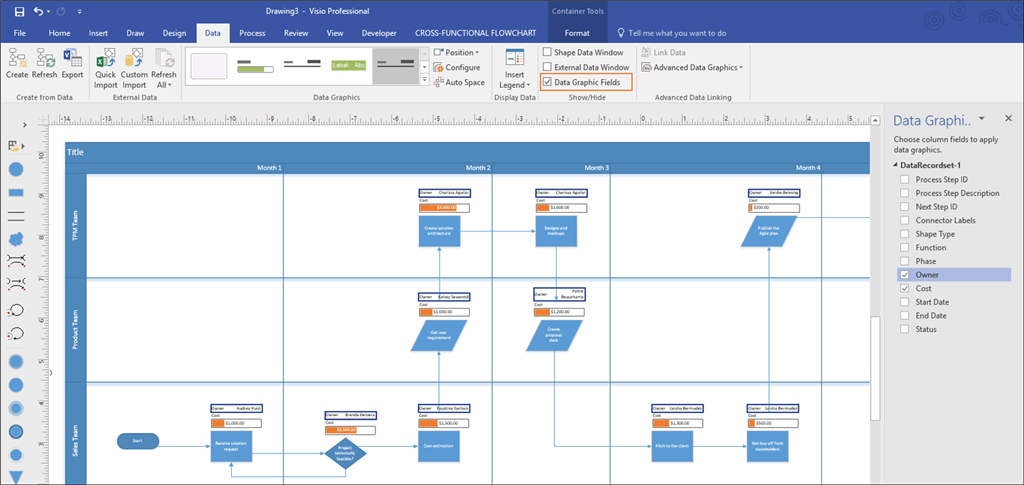
We've got a cool feature update for you, now enhance your Data Visualizer diagram by adding data graphics! Visualize the key metrics in your process map Excel data using Visio data graphics. For example, notice how an analyst can overlay the process
step cost and owner information on the diagram using data graphics as follows.
Note: To use the Apply Data Graphics to Data Visualizer diagram feature in Visio Pro for Office 365, you must be an Office Insider.
Updated: 5/22/2017
We've got some great feature updates for you! The following new Data Visualizer feature enhancements are available in app version 16.0.8067.2115 (or above):
Create your Visio process diagram automatically from an Excel file stored in SharePoint document library! Now work collaboratively on your process map in Excel and import it in Visio to automatically create the diagram
Now you can create your process diagram automatically with stencils of your choice. Check out the details here
Thank you for all your feedback, it really helps us in improving the feature. We invite you to try it out once again and let us know if there are any other improvements we should make.
------------------------------------------------------------------------------------------------------------------------------------
Hello,
I am Shashank Gandhi, and I work as a Program Manager for team Visio at Microsoft. Back in October 2016, we released an early preview of the Data Visualizer feature in Visio. We created this feature for those of you who would like to present your process map requirements captured in Excel in a structured format, and automatically convert those to diagrams. This helps with:
Generating standardized data driven diagrams
Creating diagrams quickly by converting Excel data to Visio diagrams

We’ve received some fantastic feedback on the Data Visualizer feature (referred to as Visio smart diagrams earlier) from Insiders. Your insights have been invaluable for us as we continue to make improvements on this feature. As our valued Insider, we are pleased to share with you a first look at the improvements we’ve made since we announced this feature last fall.
You can get a quick overview by watching this video:
What's improved since the last Insider preview?
We’ve added several new features based on asks from our Insider customers --
Out- of-box Visio and Excel data templates to create diagrams
A wizard based UI to map Excel data columns to create diagram

Improved layout for automatically created diagrams

Refresh diagram and keep it up-to-date as data changes

Availability
To preview the Data Visualizer feature, make sure you've checked the following --
You're an Office 365 subscriber, and have Visio Pro for O365
Microsoft Excel is installed on your machine to use this feature
You have build 16.0.7967.2030 or later installed (see update from May 22, 2017 on top).
Check your Office app version by going to File > Account
Update to the latest version by clicking File > Account > Update Options > Update Now
Restart Visio app once after updating
Scenarios to try
a) Creating a diagram from data in Excel
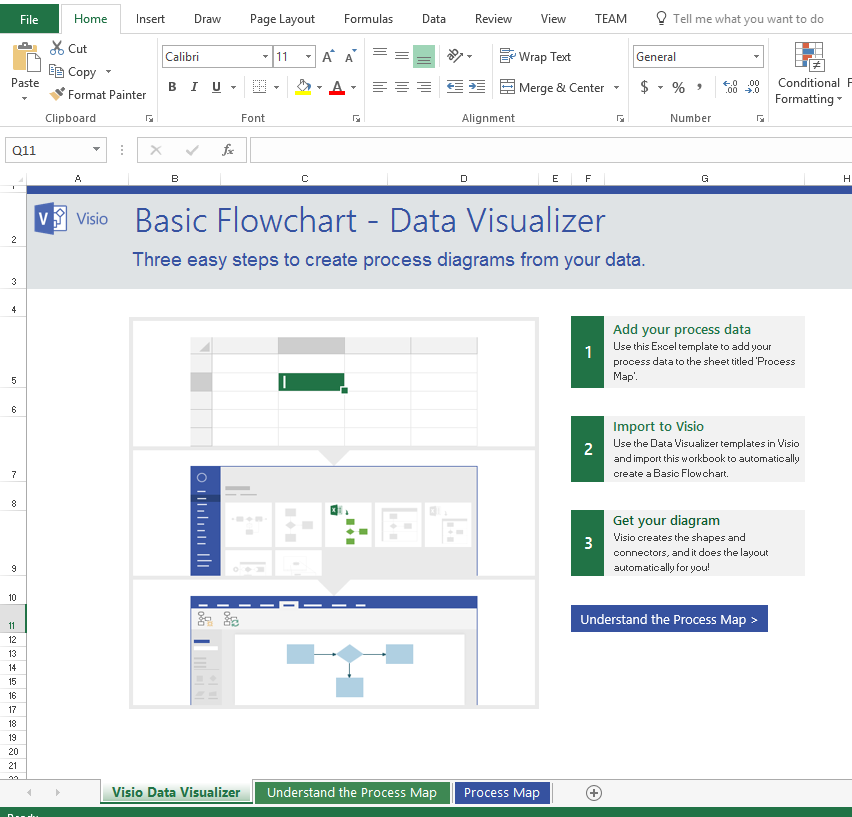
Launch Visio and go to File > New and then click Templates

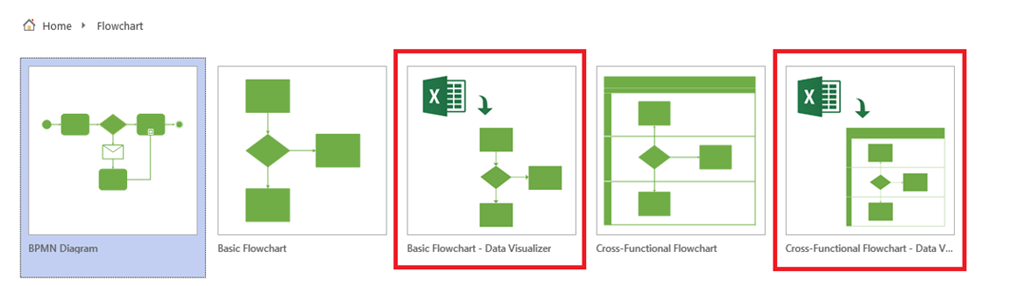
2. On the Template Categories, click the Flowchart tile. You will see two Data Visualizer templates
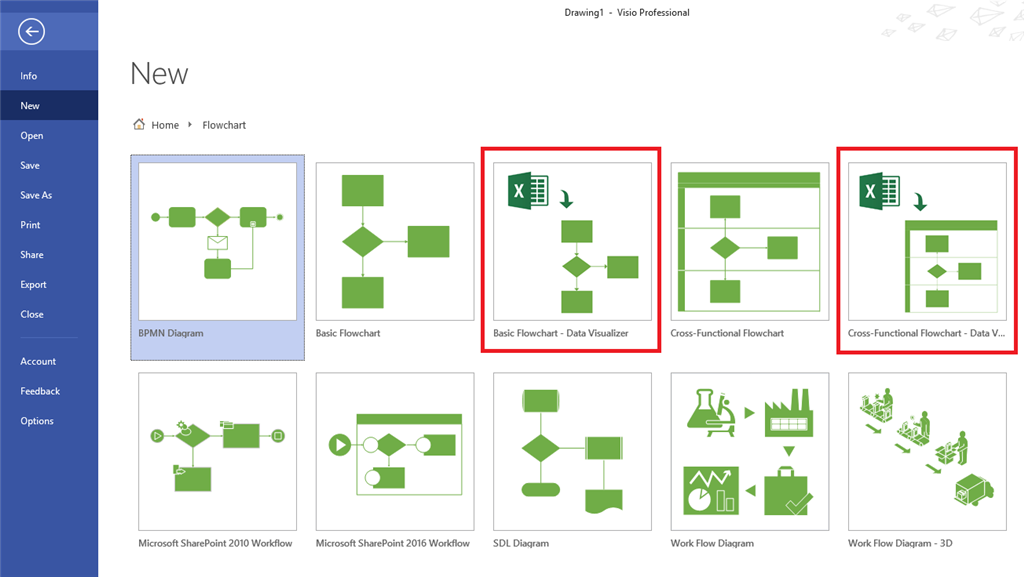
3. Click on any of the two templates to launch template preview. In the description, you’ll see a link to an Excel data template that helps you represent your process flowchart steps in Excel.

4. Enter your process steps in the Excel and save the file. The Excel file has help content and snapshots of sample data to get you started.

5. Go back to the Data Visualizer Visio template preview and click Create. The diagram creation wizard gets launched automatically.
In the Create a Diagram from Data wizard, click Browse, and navigate to the Excel file you just created for the process steps. All diagram mappings will get pre-populated.
6. Click Next to customize or Finish to create the diagram.

b) Refresh your diagram
Add new data rows or modify existing ones in the source Excel file and save your Excel file
Select the diagram container in Visio and click Refresh (in the Data Tab ‘Create from Data’ section) to update the diagram
Note:
Any customizations you make to the existing shapes in the diagram will be preserved on Refresh
Example: Shape formatting changes, adding comments to shapes etc. will not be preserved post refresh
However, any new shapes added to the diagram on canvas will be lost after refresh. To add new shapes/ modify Swimlane or Phase/ modify connections, please update the data and then click on Refresh
c) Export as a Template Package
Once your diagram is created, share it as a template package with others in your organization. The template package enables users to share the diagram and associated data file together with the diagram mappings preserved in the template itself!
Create mappings once and re-use them across your organization
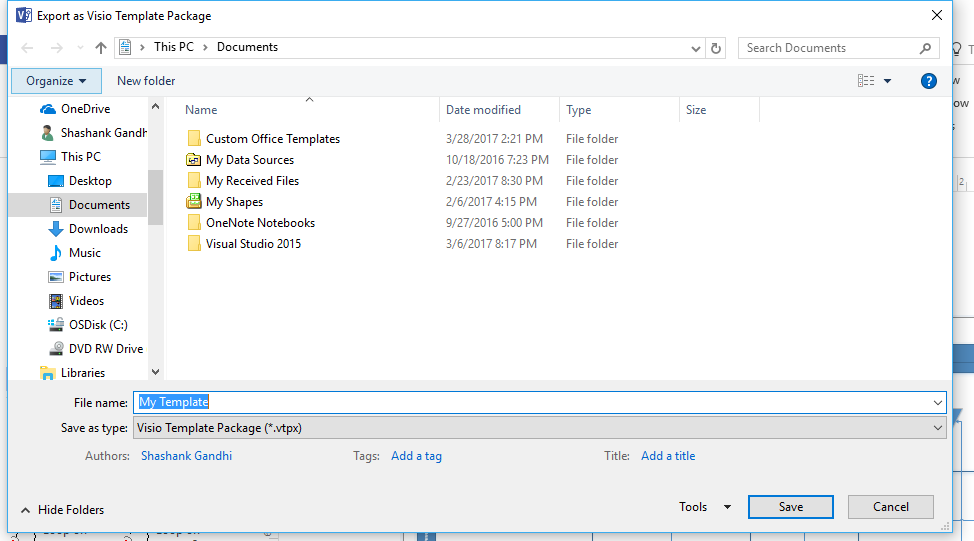
Once you have created your diagram, select the diagram container, and click on Export (in the Data Tab ‘Create from Data’ section)

2. Save the template package using the save dialog
3. You can find the template package (.VTPX) in the saved location, share it with another user or install the package in your own machine by double clicking on the file.
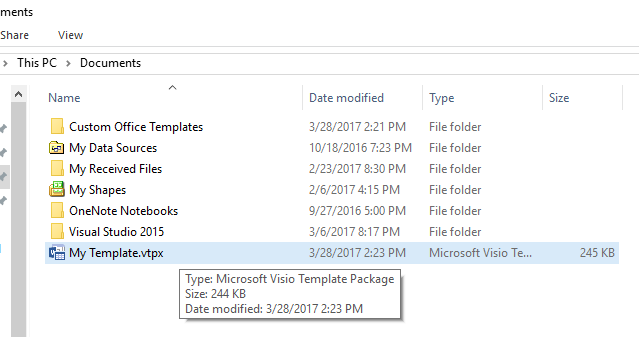
4. Double clicking on the .VTPX file places the Visio template in the Personal Tab for templates, in Visio backstage

5. Single click on the template thumbnail to open the template preview, you will find the link to the associated Excel file in the preview

6. Open the Visio template and point it to the Excel file associated with the template. You will find all diagram mappings pre-populated in the wizard!
Send us your feedback
Did you hit any rough spots, have suggestions for improvement, or looking for more ways to automatically create any other diagram types? We’d love to hear from you! You can leave a comment on this post or send us an email at <dv-feedback[at-the-rate]microsoft.com>
Have any other feature ask for automatic creation of diagrams from data? Post your suggestions/ ideas at Visio User Voice.
Thank you!
Shashank Gandhi and team
Resources
Create a Data Visualizer diagram
Use the Create Diagram from Data wizard
Data Visualizer Frequently Asked Questions

