
In an Excel 2016 spreadsheet, I have a column with dates and a column with agents.
I would like to count the cells containing distinct dates that meet a criterion shown in another column.
Specifically, I should like to count the number of cells containing a distinct date, where Agent is given in another column.
DATE Agent
Date1 Mike
Date2 Mike
Date1 Joe
Date2 Steve
Date1 Mike
Date2 Steve
Date3 Joe
Date3 Joe
Date3 Joe
Total number of rows in range = 9.
Total number of cells containing Mike = 3, Joe = 4, Steve = 2.
The number of cells containing distinct dates relating to Mike = 2, Joe = 2, Steve = 1.
What formula do I use to calculate this?
Hello,
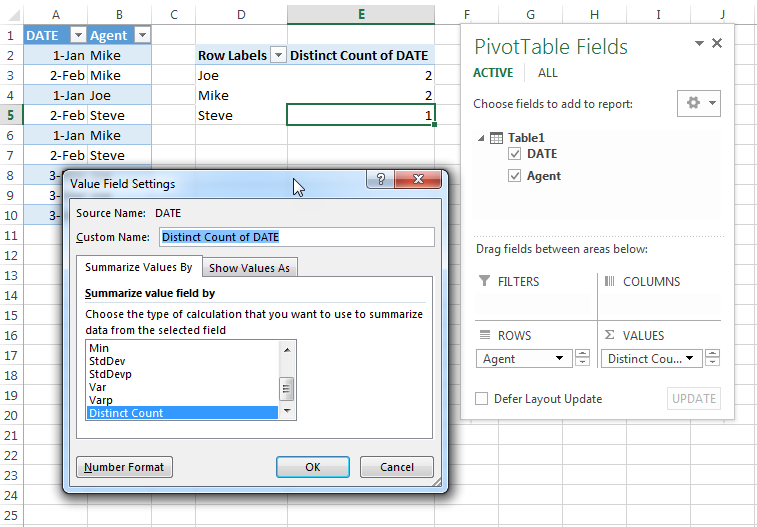
you can do this with a pivot table. Click the source data, then click Insert > Pivot Table. In the dialog to create a pivot table, tick the box to "Add this data to the Data Model".
Drag the Agent Name to the row area, drag the Date to the Values area, where it will show as Count of Date. Right-click the Count of Date and select Value Field Settings. Scroll down the list of functions to the bottom and select Distinct Count.
If you need more detailed steps, look at this blog post by Mike Alexander:
Distinct Count in Pivot Tables – Finally in Excel 2013
If you don't want to use a pivot table, you can use a formula as explained in this Microsoft article, but the formula is quite involved.
cheers, teylyn
Community Moderator
www.teylyn.com
Report abuse
Details (required):
Thank you.
Reported content has been submitted
4 people found this reply helpful
·Was this reply helpful?
Sorry this didn't help.
Great! Thanks for your feedback.
How satisfied are you with this reply?
Thanks for your feedback, it helps us improve the site.
How satisfied are you with this reply?
Thanks for your feedback.