I am trying to update the link for the Horizontal Axis labels in an Excel chart. The six labels show correctly in the select data preview screen, but not on the chart (just shows numbers 1 - 6).
As I suspected, two of the series, the lines on the primary axis, nave no X values. Their series formulas are
=SERIES('Break Even Model'!$A$12,,'Break Even Model'!$B$12:$G$12,3)
=SERIES('Break Even Model'!$A$11,,'Break Even Model'!$B$11:$G$11,2)
The two series on the secondary axis are
=SERIES('Break Even Model'!$A$9,'Break Even Model'!$B$1:$G$1,'Break Even Model'!$B$9:$G$9,1)
=SERIES('Break Even Model'!$A$10,'Break Even Model'!$B$1:$G$1,'Break Even Model'!$B$10:$G$10,4)
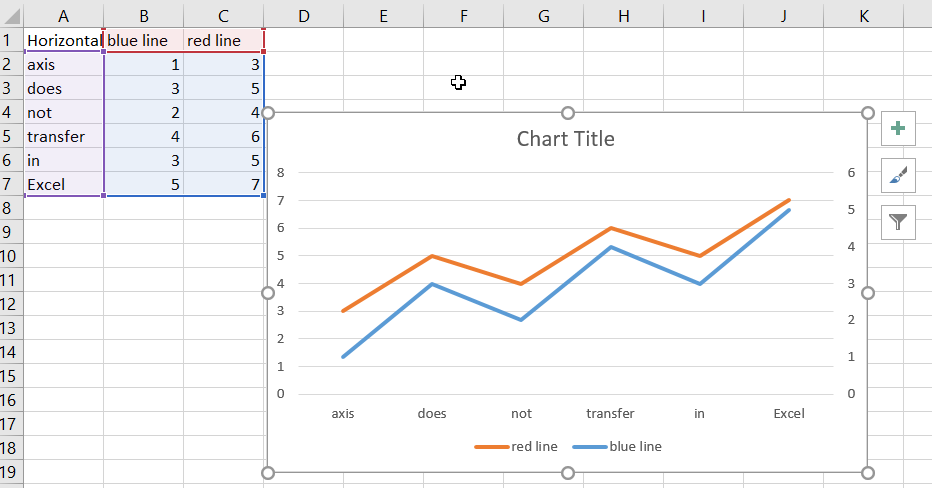
The chart has primary and secondary Y axes, and only primary X axis. The primary X axis uses the X values for the primary series, which are not included in the series formula. Since they are not included, Excel just uses 1, 2, 3, etc.
copy the X values
'Break Even Model'!$B$1:$G$1
from one of the secondary axis series formulas, and paste it into either of the primary axis series (either one, Excel fills in both), and now Excel knows what to plot on the primary X axis.
Problem solved.
Jon Peltier Peltier Technical Services, Inc. MS Excel MVP 2001 to now
12 people found this reply helpful
·
Was this reply helpful?
Sorry this didn't help.
Great! Thanks for your feedback.
How satisfied are you with this reply?
Thanks for your feedback, it helps us improve the site.
I can feel your frustration, but let's clarify something: I don't work for Microsoft. Everything I do here I do as an unpaid volunteer, spending my own free time to help people with questions about Excel.
I created the data set in Excel 2016, selected the data and inserted a line chart. I sent one line to the secondary axis. The X axis still shows the correct labels. I sent the other line to the secondary axis and brought the first line back to the primary
axis. The X axis labels are still correct. In short, I cannot reproduce the problem.
That's why I would like to see your file.
Point your browser to
onedrive.live.com and log in with the same user account and password you use for this forum. OneDrive is free online storage from Microsoft, tied to your Microsoft account. In OneDrive there is a folder called "Public". Upload your file to that folder.
Then select the file and click the "Share" command, then "Get a link". Copy the link and paste it into a comment here, then I can access the file. It may very well be the sample with the two lines.